Custom colormaps#
MintPy support the following colormaps:
- Matplotlib colormaps
- Custom colormaps:
cmy,dismph, andromanian - Custom colormaps in .cpt (color palette tables) format. To add your own colormap, drop the corresponding .cpt file in
$MINTPY/mintpy/data/colormaps.
We recommend to use cyclic colormap cmy for wrapped phase/displacement measurement.

To use colormap cmy in view.py:
view.py velocity.h5 -c cmy
To use colormap cmy in python:
from mintpy.colors import ColormapExt
cmap = ColormapExt('cmy').colromap
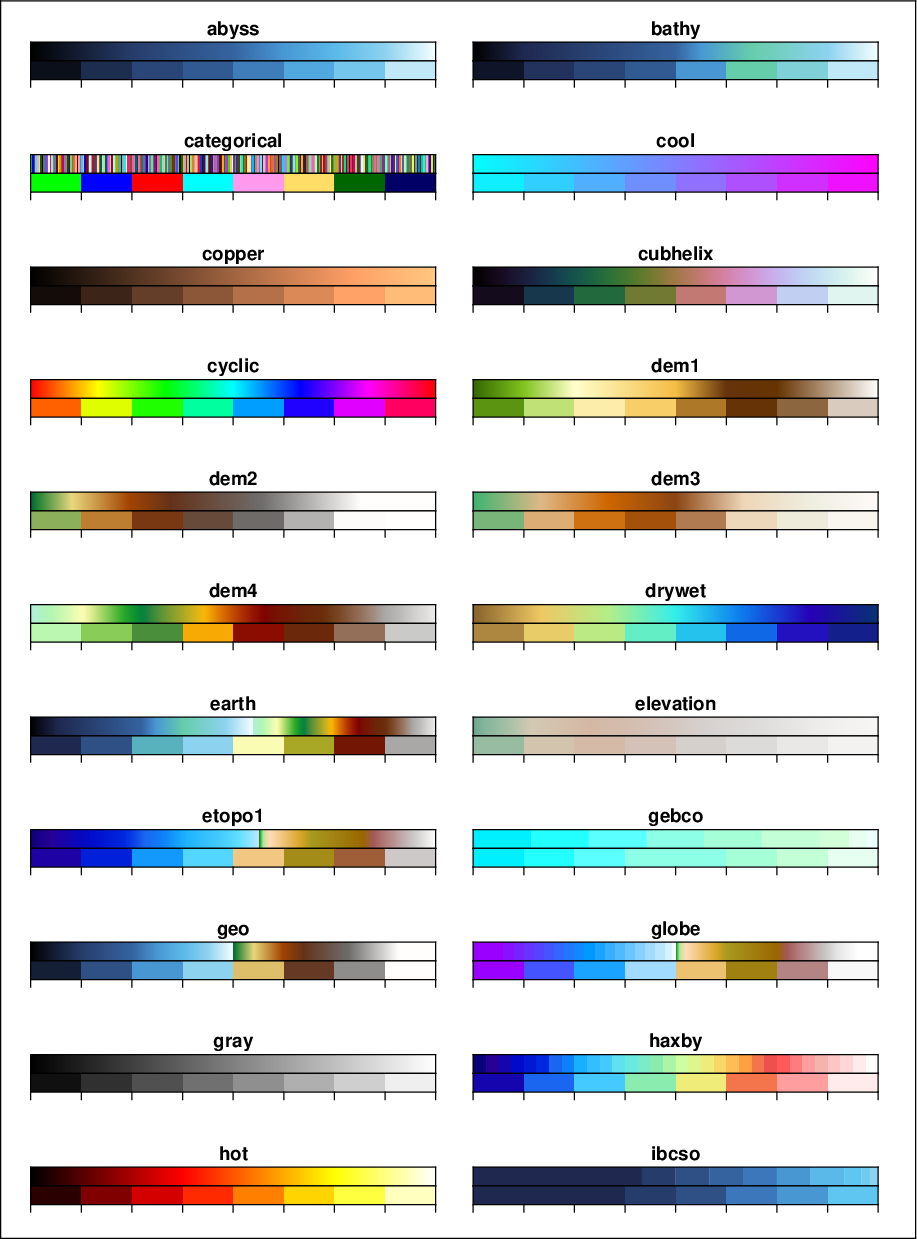
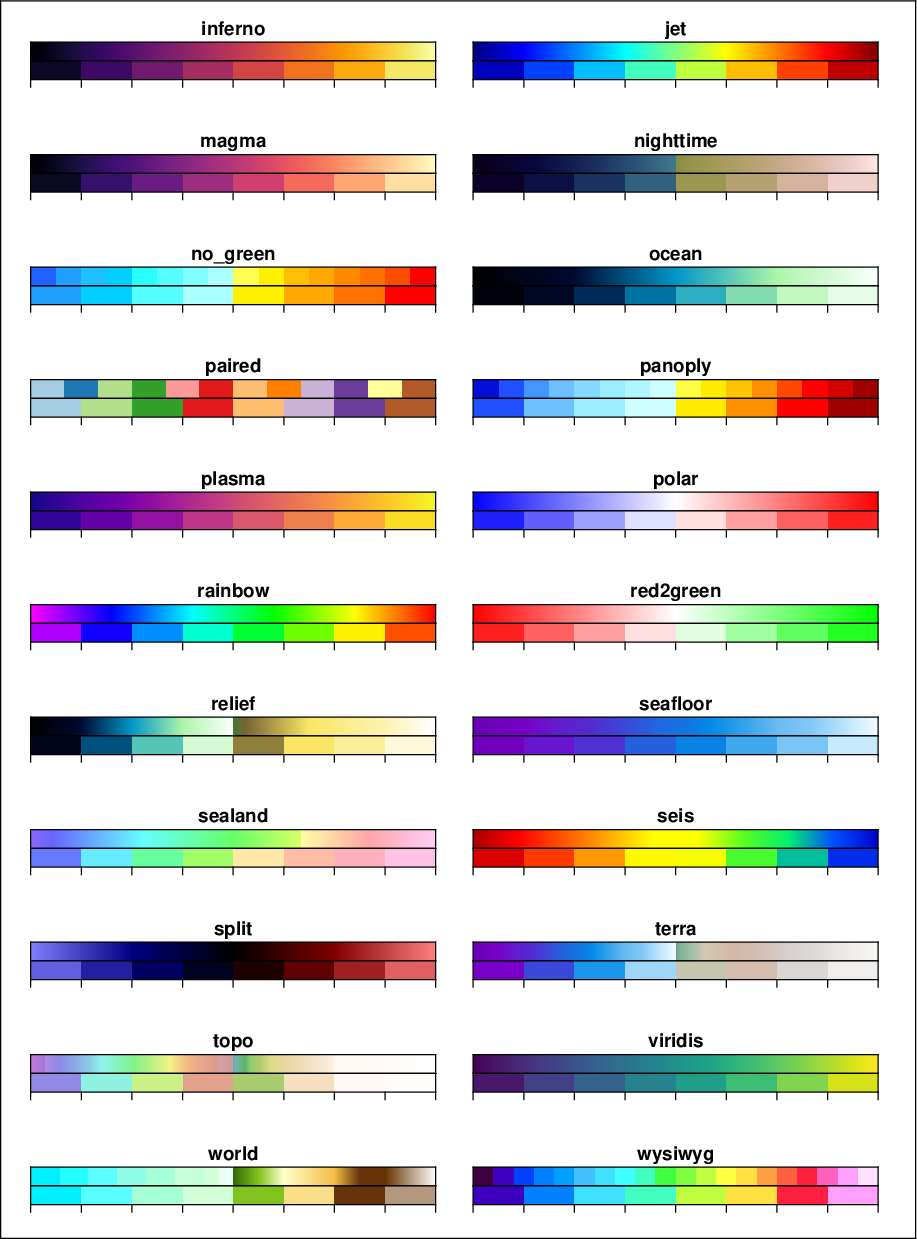
Colormaps from GMT#
All GMT cpt files, e.g. the 20 built-in colormaps shown below, can be recognized by setting the variable GMT_CPT_DIR in $MINTPY_HOME/src/mintpy/objects/colors.py. The default hardwired value is /opt/local/share/gmt/cpt for macOS users with GMT installed using MacPorts.
Colormaps from cpt-city#
The following colormaps is included by default:
- BlueWhiteOrangeRed
- DEM_print
- differences
- GMT_haxby
- GMT_no_green
- seminf-haxby
- temp-c
- temperature
- wiki-2.0
- wiki-schwarzwald-d050
- wiki-scotland
- More at cpt-city
Colormaps from Scientific Color-Maps by Fabio Crameri#
The following colormaps is included by default:
- batlow (the scientific rainbow)
- hawaii
- oleron (surface topography)
- roma (seismic tomography)
- vik (diverging)
- vikO (cyclic diverging)
- More at Scientific Color-Maps (Crameri, 2018)

Interactive web tool to generate custom colormaps by Jon Herman#
This web tool creates a custom colormap (for Matplotlib/Matlab) by dragging points on the RGB intensity curves.
- Choose output as plaintext style and RGB format.
- Copy and save the RGB table to a text file
- Use this script rgb2cpt.py to convert the RGB table to 8-column CPT file with heading, overrule background, foreground, and NaN colors.